Quickstart: Classify a Nonlinear Dataset with the Photonic Quantum Layer
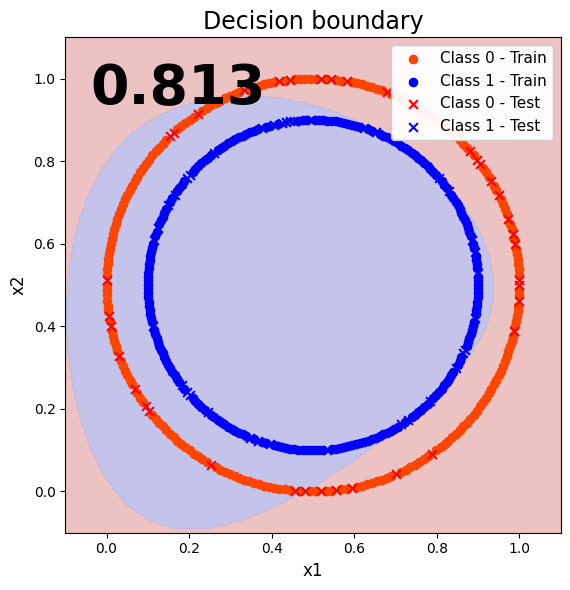
This page is dedicated for new users of MerLin! The following notebook will show how to install MerLin and use it to create a small quantum model to classify a non-linear dataset (circles dataset). This dataset was chosen because it is simple, visual and non-linear, making it perfect to observe how MerLin is behaving. The dataset can be represented as two circles centered around the same point. Each circle has a different radius and label. It is a 2 feature and 2 label dataset,
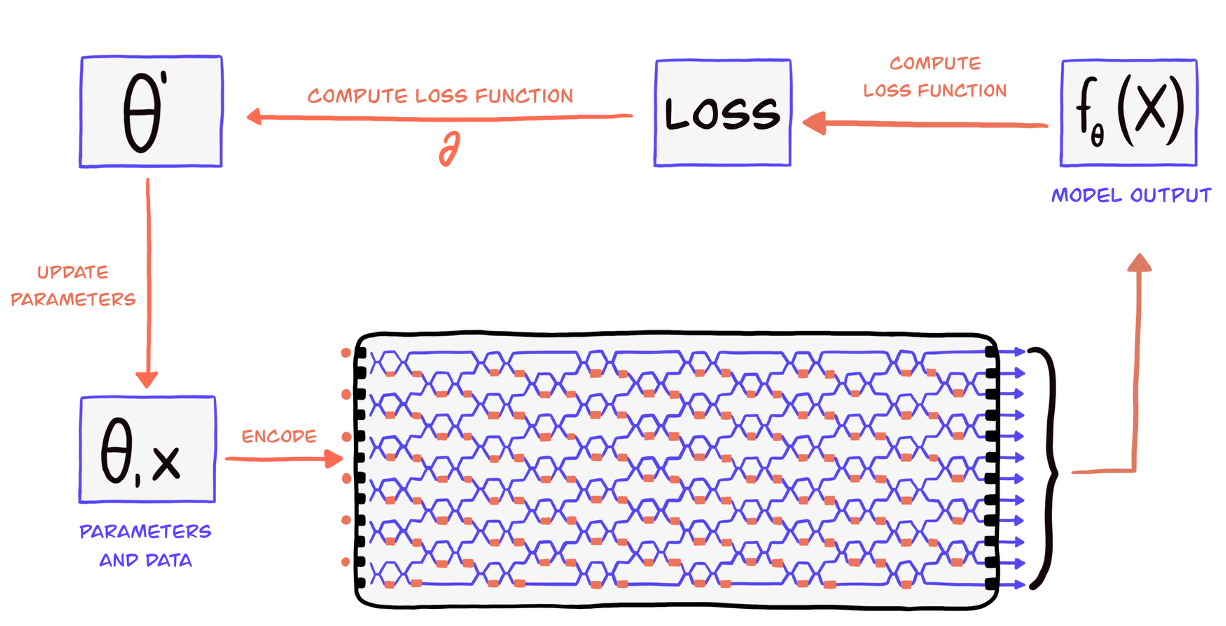
You will learn how to create a MerLin QuantumLayer, the basic module of this library. You will also realize that this object is a torch.nn.Module. That means that MerLin plugs directly into pytorch.
We obtain a 81.3% accuracy on the dataset.
Next steps
To enhance your experience with MerLin we suggest to consult the following pages.
Your first quantum layer
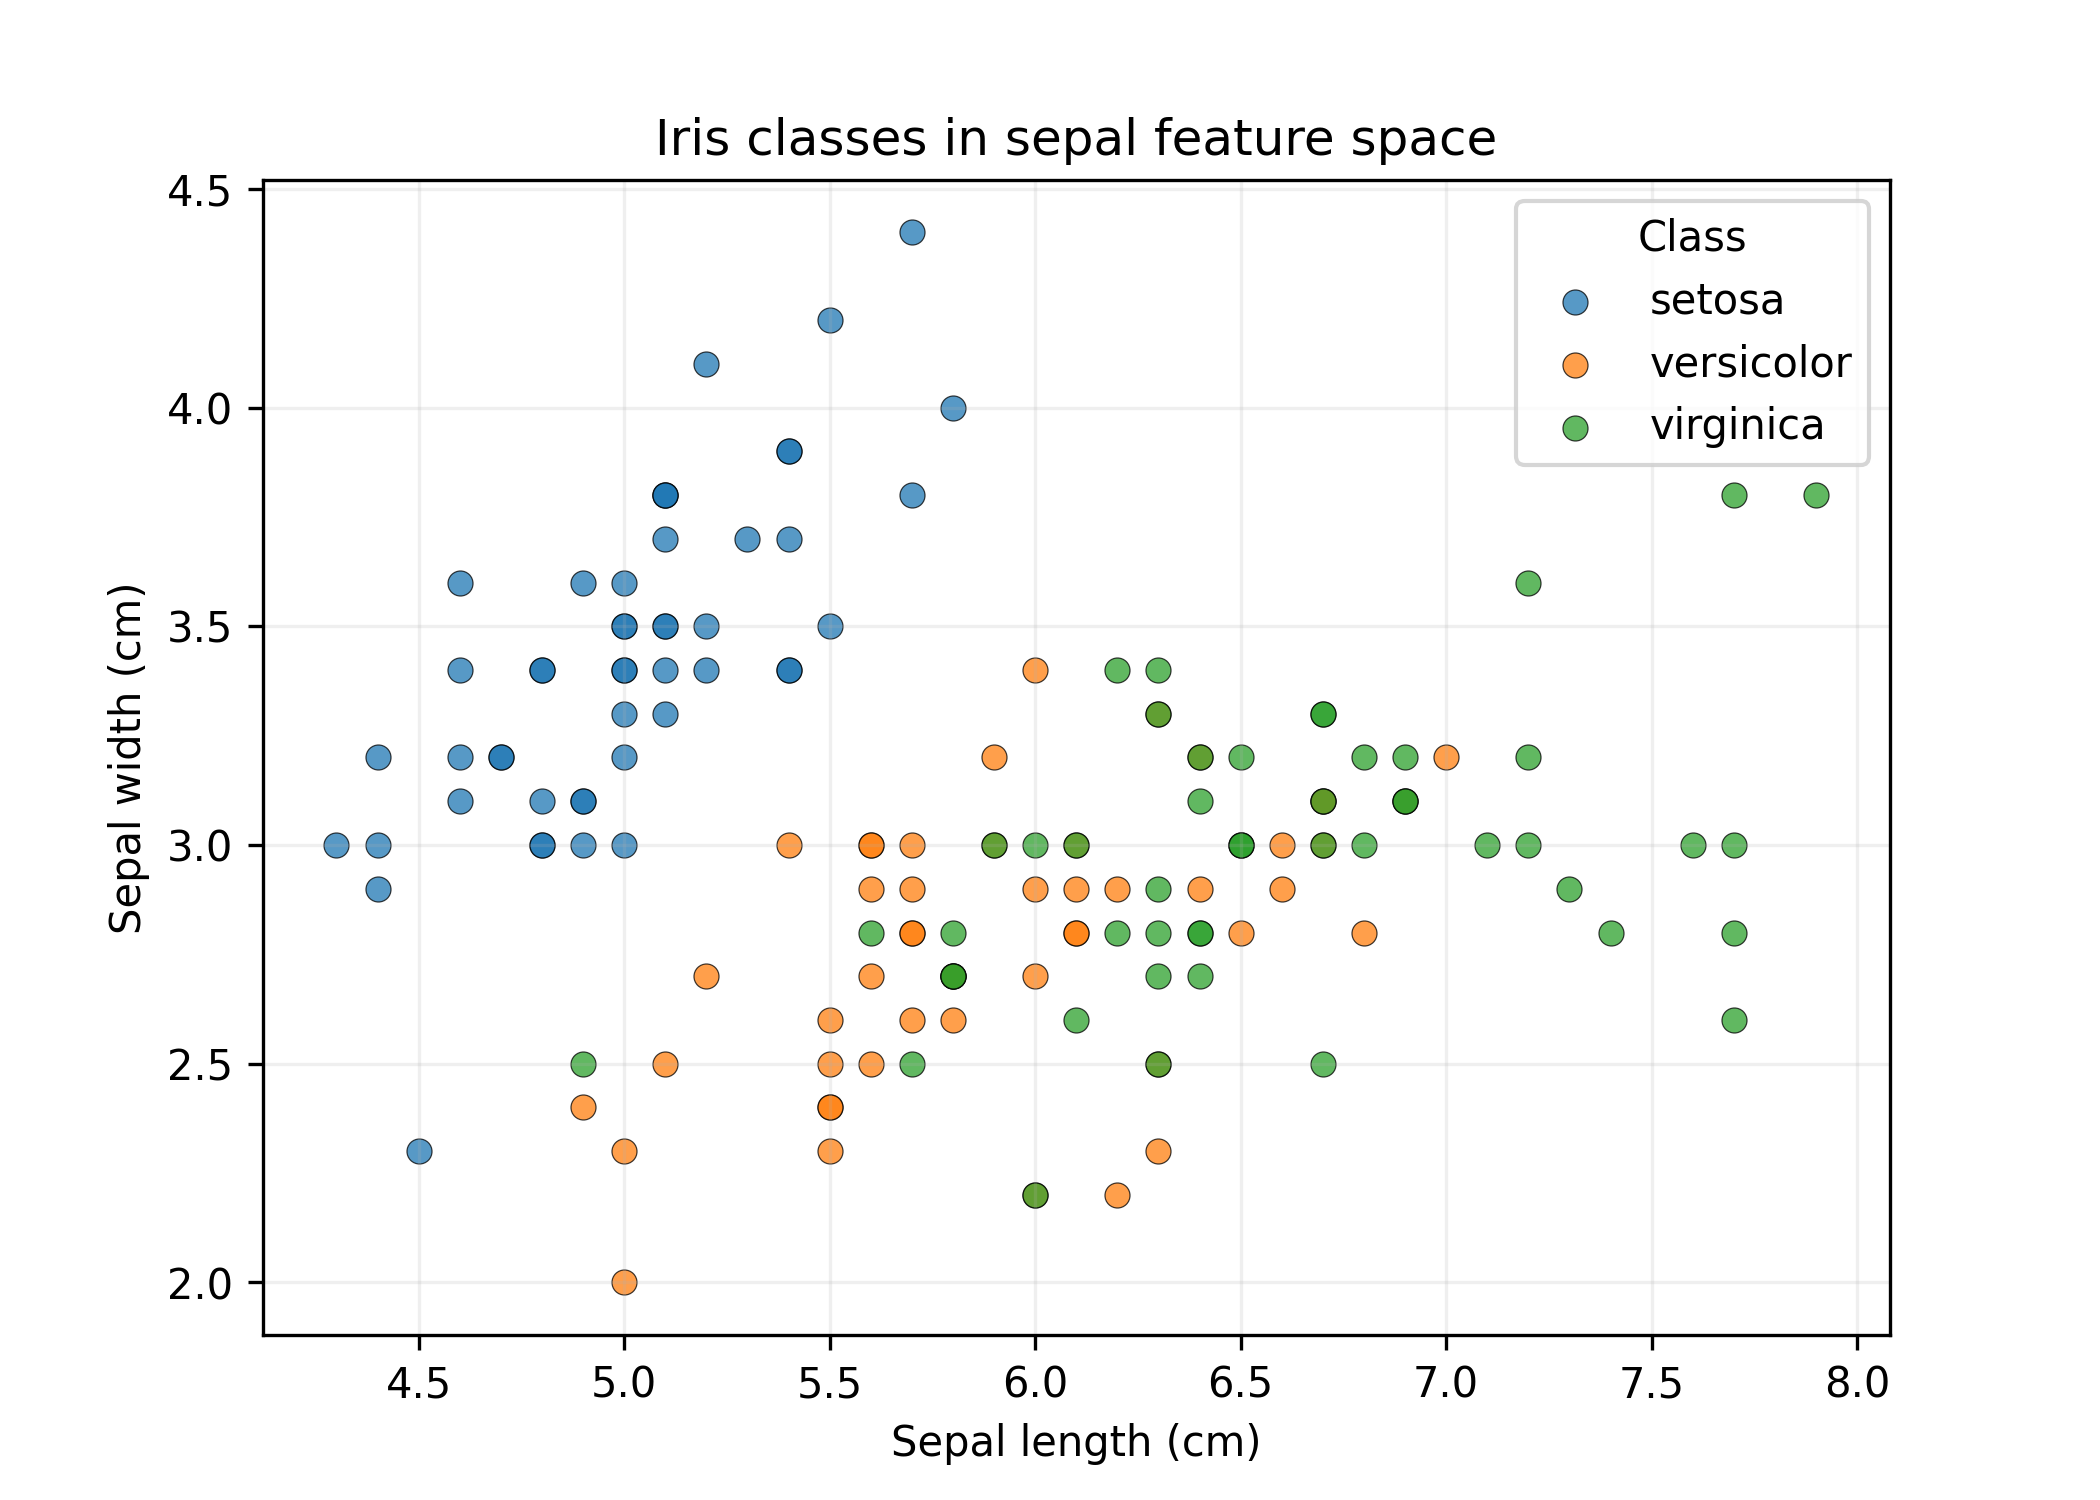
A deeper walkthrough of creating a QuantumLayer to classify the Iris dataset.
A guide to CircuitBuilder
How to use MerLin's circuit builder to easily create custom quantum layers.
QML basic concepts with MerLin
Explore the basics of QML with MerLin.

Other MerLin examples
Check out all of the other examples of QML tasks with MerLin.